
Hi friends, in today’s article we are going to know about the relationship between Short run and Long run average cost curve and Marginal cost curves. So let’s discuss in details.
Table of Contents
Relationship between Short run and Long run average cost curve
The relationship between Short run and Long run average cost curve and marginal cost curves are explained below with the help of a diagram.
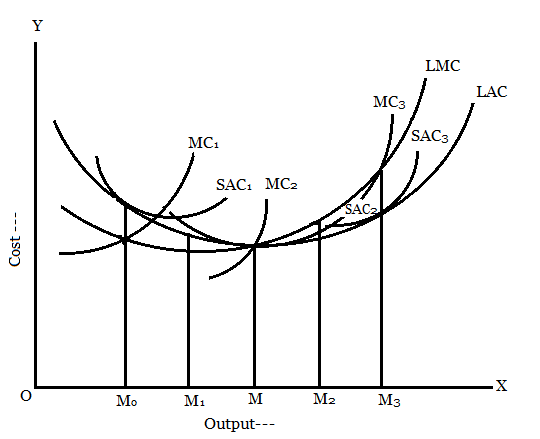 In the above diagram, LAC and LMC are the long run average and marginal cost curves respectively. Three short run situations are indicated by the three sets of short run average and marginal cost curve SAC1, MC1, SAC2, MC2 and SAC3, MC3.
In the figure SAC1 and MC1, short run curves for the plant size designed to produce output Mo optimally. Since the short run cost curve would be tangent to the long run average total cost curve at this output, the two average cost curves are also tangent at this output.
Since the marginal cost is given by the slope of the total cost curve, long run marginal cost equals short run marginal cost at the output given by the point of tangency Mo. Finally short run marginal cost crosses short run average cost at the latter’s minimum point.
So Mo is on the decreasing portion of LAC, SAC1, must also be decreasing at the point of tangency. SAC2 is the short run average cost curve corresponding to the output level plant size at which long run average cost is at its minimum.
At output level M the two average cost curves are tangent. The two marginal cost curves, MC2 and LMC are also equal at this level of output.
Since both average cost curves attain their minimum at M point, the two marginal cost curves must intersect the two average cost curves. Thus, all four curves must intersect the two average cost curves, i.e. all four curves are equal at output Mo. That is at M, LAC = SAC2 = MC2 = LMC
Relation of SAC, LAC, SMC and LMC
The relation of SAC, LAC, SMC and LMC can be summarized as follows –
(i) SAC represents the costs of a single plant, whereas LAC represents the cost of different plants. Both SAC and LAC are U shape of LAC is less pronounced as compared to SAC. LAC can not be more than SAC. That is why LAC is tangent to SAC. Except to the one SAC curve, LAC not tangent to SAC at their minimum point.
(ii) SMC (MC) refers to the effect on total cost due to the production of one additional unit of output on account of variable factors. LMC refers to change in total cost due to production of one more or less unit of output due to change in all factors.
When a firm selects a proper scale of plant in order to produce a given quantity of output then at this level of output short run and long run marginal cost curves are equal.
Conclusion
So friends, this was the relationship between Short run and Long run average cost curve and Marginal cost curves. Hope you get the full details about it and hope you like this article.
If you like this article, share it with your friends and turn on the website Bell icon, so don’t miss any articles in the near future. Because we are bringing you such helpful articles every day. If you have any doubt about this article, you can comment us. Thank You!
Read More Article
• Relationship between Investment and Rate of Interest
• What is producer equilibrium? | Producer equilibrium class 11